
May 11, 2026
The Real Cost of Data Annotation in 2026: Why Your $0.05 Label Is Actually $0.40
You just got a quote of $0.05 per label for your next annotation project. Your project needs 200,000 labels. $10,000 total. Your head of finance is thrilled.
Here's what that quote won't tell you: by the time the labels are actually usable in a production model, you'll have spent between three and eight times the sticker price. The rest doesn't show up on any single invoice, which is exactly why it never gets budgeted.
This post is the honest math. We'll walk through every cost category — the visible and the invisible. We'll work through three real-ish scenarios at different team sizes. And we'll give you a formula you can apply to your own situation, today, to figure out what you're really paying per high-quality label.
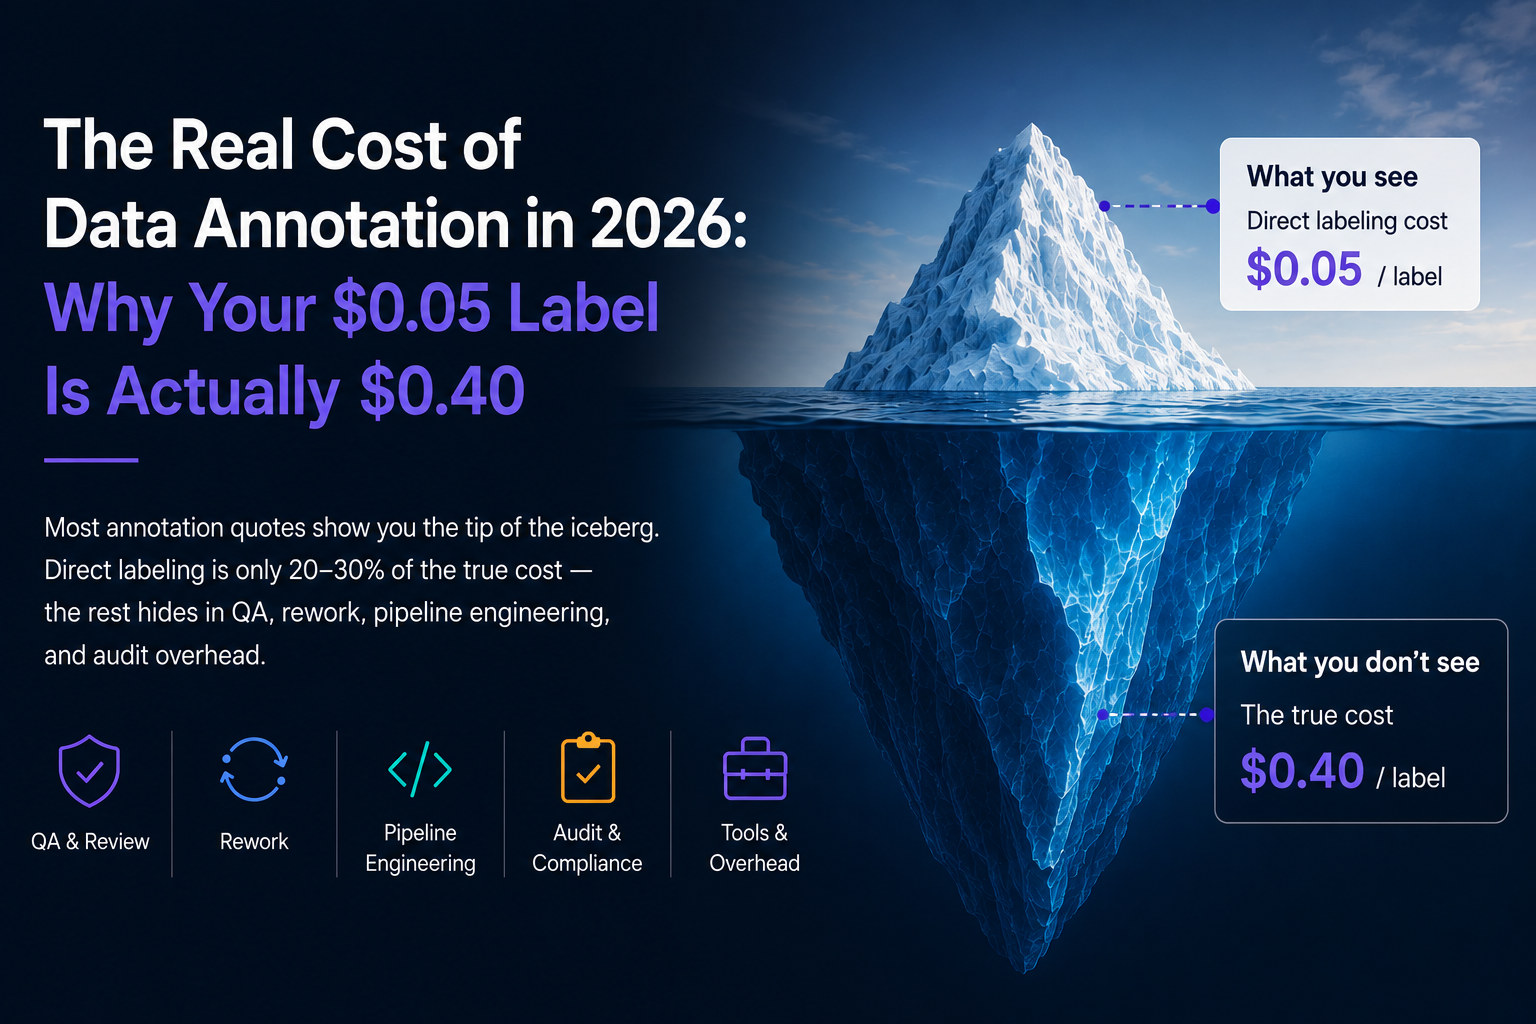
The Iceberg
Think of the total cost of annotation as an iceberg. The part you see — the per-label quote — is maybe 25% of the total. The rest is under the water.
Above the waterline: direct labeling cost. This is the number on the quote. It's what your annotation vendor or in-house team charges per label or per hour.
Below the waterline, in rough order of magnitude:
Review and QA cost — 40-60% of direct labeling cost. Every label typically gets reviewed at least once. Good pipelines have two-stage or three-stage review. Reviewers cost more than annotators, and they produce fewer labels per hour.
Rework from bad labels — 15-40% of direct labeling cost, depending on vendor quality. When a batch comes back with unacceptable error rates, it gets re-labeled. Sometimes you catch it in QA. Sometimes you catch it when your model underperforms and you trace the issue back. Either way, the rework is real cost.
Pipeline engineering time — often 30-50% of direct labeling cost, quietly. Someone has to write the export script from your annotation tool. Someone has to write the import to your training pipeline. Someone has to reconcile format differences. Someone has to debug the edge case where a polygon wraps around the image boundary. This is hours of senior engineering time that never gets charged to the annotation budget line.
Audit and compliance overhead — 10-25% at enterprise scale. SOC 2 audits require annotation workflow documentation. GDPR asks for data minimization. Regulated industries need audit trails showing who labeled what and when. Building and maintaining this is real operational overhead.
Tool licensing — 5-20% depending on your stack. Enterprise annotation platforms, dataset management tools, experiment tracking, model registry — each one carries a licensing cost that's separate from the labeling cost but required for the labeling cost to convert into a usable model.
Coordination overhead — often ignored but real. Standups, spec updates, taxonomy clarifications, vendor management calls. Your head of data operations spends 20% of their time on annotation logistics. That's a real cost too.
Worked Example 1 — The Seed-Stage Startup
Team: 3 ML engineers, one product manager. 50,000-image pilot dataset needed.
Quoted at $0.04/label from a reputable vendor. Looks like $2,000.
Add in:
Review time — one senior engineer spends 40 hours reviewing the returned labels and flagging the ~8% that need rework. At $150/hour loaded cost, that's $6,000.
Rework — 4,000 labels re-labeled at the same vendor rate: $160.
Pipeline — converting from vendor's custom JSON to a training-ready format: 15 hours of engineering time: $2,250.
Taxonomy and spec writing — 20 hours of PM and engineer time before labeling even started: $3,000.
Tooling — basic annotation platform at $500/month for 3 months: $1,500.
True total: $14,910 for 50,000 labels. True cost per label: $0.298 — roughly 7.5× the quoted rate.
At seed stage, this isn't necessarily wrong — you're paying for flexibility and you can't justify infrastructure yet. But knowing the real number is critical when you're planning your Series A roadmap.
Worked Example 2 — The Scale-Up
Team: 8 ML engineers, 2 data engineers, 1 data operations lead. 2M labels per year across three product lines.
Quoted at $0.03/label for 2M labels. Looks like $60,000/year.
Add in:
In-house QA lead — $120,000/year loaded.
Two senior engineers spending 25% of their time on annotation pipeline maintenance — $75,000/year.
Rework costs from batches that come back below quality threshold — estimate 18% of direct cost — $10,800/year.
Annotation platform license — $60,000/year.
Dataset versioning tool (or build-your-own maintenance) — $40,000/year equivalent.
Integration maintenance as your training pipeline evolves — $25,000/year.
True total: $390,800/year for 2M labels. True cost per label: $0.195 — roughly 6.5× the quoted rate.
At this stage, the team is paying serious money and still feeling the pain of a stitched stack. The hidden costs are where platform consolidation ROI starts to become undeniable.
Worked Example 3 — The Enterprise
Team: 40+ ML and data engineers across multiple product lines, with separate model ops, security, and compliance stakeholders. 20M labels per year.
Quoted direct labeling at $0.025/label for managed service. Looks like $500,000/year.
Add in:
Full QA team of five — $750,000/year loaded.
Data ops team of four maintaining ingestion, versioning, and training pipelines — $800,000/year.
Multi-platform tool licenses (annotation + versioning + training orchestration + registry + monitoring) — $600,000/year.
Rework and audit overhead — $350,000/year.
Compliance engineering time for SOC 2, GDPR, and sector-specific regs — $200,000/year.
True total: $3.2M/year for 20M labels. True cost per label: $0.16 — 6.4× the quoted rate.
Enterprise buyers are the ones most likely to see these costs plainly, because they show up as line items in multiple departmental budgets. They're also the ones where platform consolidation has the biggest ROI — cutting tool stack costs, reducing integration engineering, and unifying compliance overhead typically saves 30-50% of the hidden-cost columns.
Where AI-Assisted Labeling Actually Saves Money
AI pre-labeling and active learning get marketed as cost-cutters. The reality is more nuanced.
They save money when:
Your dataset is large enough that the inference cost of the pre-labeling model is amortized across tens of thousands of labels. Below about 10,000 labels per task, pre-labeling often costs as much compute as it saves labor.
Your label type is one pre-labeling models handle well — bounding boxes, common object detection, semantic segmentation with well-understood classes. Custom taxonomies with rare categories get mediocre pre-labels.
Your QA workflow is set up to verify fast rather than re-draw. If your reviewers end up redrawing most pre-labels, you've just added a step without saving work.
They don't save money when:
Your dataset is small and bespoke. A 2,000-image pilot for a novel use case is faster labeled by hand than with the overhead of setting up pre-labeling.
Your label quality bar is very high and your pre-labeling model is mediocre. You end up redoing most labels and paying inference on top.
Your active learning loop isn't properly integrated. If 'active learning' means 'someone exports a CSV and picks the low-confidence examples manually,' the overhead kills the savings.
The honest claim is: AI-assisted labeling saves 30-70% when the integration is done well, and costs more when it's done badly. There is no middle ground.
The Formula You Can Use Today
Here's a simple formula to estimate your true cost per high-quality label, usable today without any new data collection.
True Cost Per Label = (Direct Labeling + QA + Rework + Pipeline + Tooling + Compliance) / Usable Labels Delivered.
Direct Labeling: what the vendor invoices or what your in-house labeler salary divided by their output equals.
QA: reviewer time spent per batch × reviewer loaded cost per hour / labels reviewed.
Rework: fraction of labels re-done × direct labeling rate + additional review cost.
Pipeline: engineering time per quarter on annotation infrastructure × loaded hourly cost / labels delivered per quarter.
Tooling: annual platform and tool costs × fraction attributable to annotation / labels delivered annually.
Compliance: compliance engineering time × loaded cost / labels.
Usable Labels: total labels × (1 - fraction rejected in QA) × (1 - fraction that cause model degradation and are later removed).
Run this calculation honestly for your own setup. Most teams who do it for the first time are horrified. That's the right reaction — because it's the real number, and once you see it, you can actually make decisions with it.
How Platform Consolidation Changes the Equation
A unified data operations platform doesn't reduce direct labeling cost much — the labor rate for humans drawing boxes is what it is. What it reduces is everything under the waterline.
Pipeline engineering drops sharply because there are no cross-tool integrations to maintain. One platform, one export format, one metadata schema.
QA overhead drops because review is built in, not a separate manual process. Your QA leads configure workflows instead of building reconciliation spreadsheets.
Tooling costs drop because you're paying one license fee instead of five — and the tiers that matter (data versioning, experiment tracking, model registry) are included rather than priced separately.
Compliance overhead drops because audit trails exist by default at the platform level, not as bolt-on documentation.
Rework drops because multi-stage QA catches issues before they enter the training dataset, rather than discovering them in model degradation six months later.
The typical pattern we see: teams that consolidate onto a platform like Intellabel reduce their true cost per label by 30-50%, without any change in direct labeling rates. The savings come from the invisible columns.
What to Do Next
If you've never calculated your true cost per label, that's the most valuable afternoon you can spend this quarter. Most teams who do it find the number is 4-8× their sticker price.
Once you have that number, you have a real basis for evaluating platforms. Compare the total cost of your current stack against the total cost of a consolidated platform. Include the hidden columns. Ask vendors for realistic quotes at your volume, not starting tiers.
If you'd like a sanity check on your numbers, or want to see Intellabel's transparent pricing mapped to your actual use case, reach out — we'll build the comparison with you. Our pricing page is public, and we encourage honest comparison.
From Labeling to Structured AI Data Pipelines

Address: WeWork, Salarpuria Symbiosis, Bannerghatta Rd, Bengaluru, Karnataka

.png)